echarts在vue内如何制作球行水滴

其实简单,之需要多加一个插件即可!

    "echarts": "^5.3.3",
    "echarts-liquidfill": "^3.1.0",


安装后即可直接使用了!
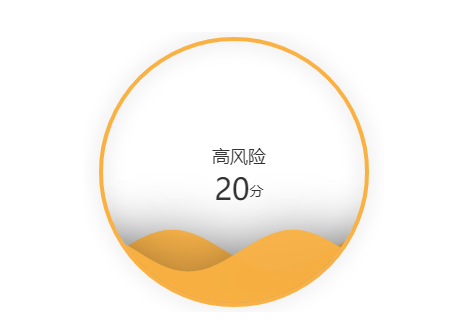
image.png

<template>

    <div class="mychart-body">
        <div class="mychart" ref="mychart"></div>
    </div>
</template>

<script>

export default {
    props: {
        value: {
            default: 0,
        },
    },
    watch: {
        value: {
            // 数据变化时执行的逻辑代码
            handler(newName, oldName) {
                console.log(this.value)
                this.setOptions(newName)
            },
            // 开启深度监听
            deep: true,
        },
    },
    data() {
        return {
            monthArr: [],
            monthGetArr: [],
            monthSize: [],
            currentMonth: '',
            myChart: '',
        }
    },
    computed: {
        title() {
            return this.value > 90 ? '低风险' : this.value > 80 ? '中风险' : '高风险'
        }
    },
    mounted() {
        this.$nextTick(() => {
            this.init()
        })
    },
    methods: {
        async init() {
            this.myChart = this.$echarts.init(this.$refs.mychart)

            var value = this.value;
            const color = value > 60 ? '#fff' : '#333'
            const subcolor = value > 50 ? '#fff' : '#333'
            const option = {
                title: [
                    {
                        text: this.title,
                        left: '50%',
                        top: '40%',
                        textAlign: 'center',
                        textStyle: {


                            color: color,
                            fontStyle: 'normal',
                            fontWeight: 'normal',
                            fontFamily: 'sans-serif',
                            fontSize: 18,
                            lineHeight: 18,
                        },
                        subtext: `{value|${value}}{unit|分}`, //`${value}{unit}个`,    // 副标题
                        subtextStyle: {    // 副标题样式
                            fontSize: '30',
                            fontWeight: '400',
                            color: subcolor,
                            textAlign: 'center',
                            textBorderColor: 'rgba(0, 0, 0, 0)',
                            textShadowColor: '#000',
                            textShadowBlur: '0',
                            textShadowOffsetX: 0,
                            textShadowOffsetY: 1,
                            rich: {
                                unit: {
                                    fontSize: 14,
                                    color: subcolor
                                }
                            }
                        }

                    },
                ],
                polar: {
                    radius: ['80%', '80%'],
                },
                angleAxis: {
                    max: 100,
                    clockwise: false,
                    axisLine: {
                        show: false,
                    },
                    axisTick: {
                        show: false,
                    },
                    axisLabel: {
                        show: false,
                    },
                    splitLine: {
                        show: false,
                    },
                },
                radiusAxis: {
                    type: 'category',
                    show: true,
                    axisLabel: {
                        show: false,
                    },
                    axisLine: {
                        show: false,
                    },
                    axisTick: {
                        show: false,
                    },
                },
                series: [
                    {
                        type: 'liquidFill',
                        radius: '95%',
                        label: {
                            show: false,
                            normal: {
                                color: '#fff',
                                insideColor: 'transparent',
                                textStyle: {
                                    fontSize: 0,
                                    fontWeight: 'bold',
                                }
                            }
                        },
                        // 圆球背景色
                        backgroundStyle: {
                            borderWidth: 1,
                            color: 'transparent',
                        },
                        data: [
                            value / 100,
                            {
                                value: value / 100,
                                direction: 'left',

                            },
                        ],
                        color: [{
                            type: 'linear',
                            x: 0,
                            y: 0,
                            x2: 1,
                            y2: 1,
                            colorStops: [
                                {
                                    offset: 0,
                                    color: '#fab143',
                                },
                                {
                                    offset: 1,
                                    color: '#fab143',
                                },

                            ],
                            global: false // 缺省为 false
                        }],
                        outline: {
                            show: true,
                            borderDistance: 0,
                            itemStyle: {
                                borderColor: '#fab143',
                                borderWidth: 4
                            }
                        }
                    },

                ]
            }


            option && this.myChart.setOption(option)
        },
        setOptions(value) {
            this.myChart.setOption({
                series: [
                    {

                        data: [
                            value / 1000,
                            {
                                value: value / 100,
                                direction: 'left',

                            },
                        ],

                    },

                ]
            })
            console.log('改变')
        },
    },
}
</script>

<style lang="scss" scoped>
.mychart-body {
    width: 300px;
    height: 300px;
    margin: 0 auto;
}

.mychart {
    height: 280px;
}
</style>


相关内容

发表评论

验证码:
点击我更换图片

最新评论